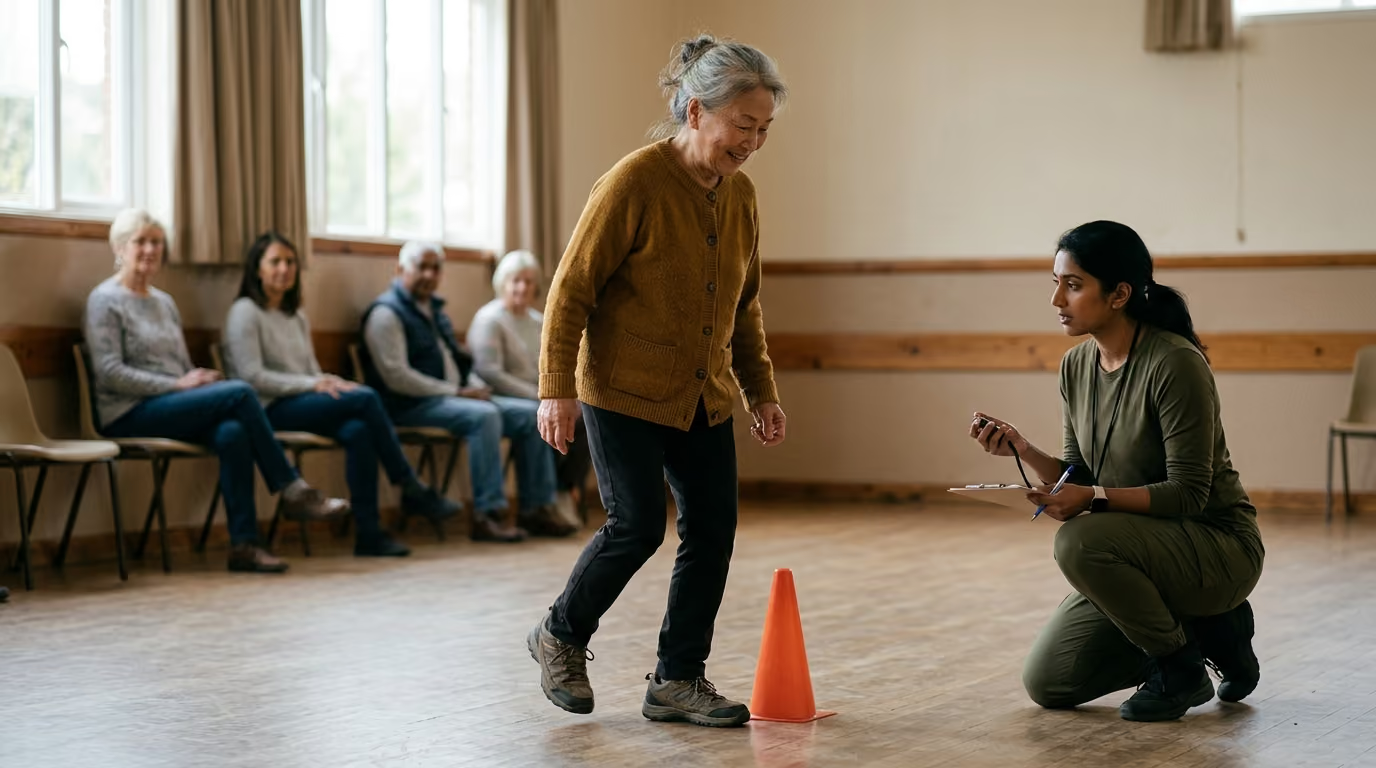

Four core functional assessments, including gait speed and grip strength, provide standardized clinical protocols to evaluate physical resilience and biological aging.





Physical function tests are objective, standardized assessments of how well an individual executes basic motor tasks. They measure integrated physical capability rather than isolated biochemical pathways. These tests do not provide a direct readout of cellular senescence, genomic instability, or epigenetic methylation patterns. Instead, they quantify organism-level performance, capturing how multiple physiological systems operate together under real-world physical demands.
Evaluating physical capability offers a practical window into the aging process. While molecular assays measure microscopic changes, performance batteries evaluate whether an individual can generate force, maintain balance, and coordinate movement. This guide examines the primary physical function tests used in geroscience, the exact protocols required for valid measurement, the empirical evidence linking performance to clinical outcomes, and the complementary relationship between functional testing and molecular profiling.
A physical function biomarker is an observable, quantifiable measure of an individual's motor capacity that reflects underlying physiological reserve. In longevity research, these assessments serve as phenotypic biomarkers. They summarize the functional integrity of the musculoskeletal, neurological, vestibular, and cardiovascular systems. Rather than focusing on a single tissue, physical tests evaluate the integrated output of the entire body.
Physical performance is distinct from both chronological age and biological age. Chronological age measures elapsed calendar time from birth. Biological aging describes the progressive accumulation of damage and loss of physiological integrity across molecular, cellular, tissue, and organ levels. Physical performance reflects the functional capacity of the organism at a single point in time. Two individuals of the exact same chronological age can exhibit vastly different functional capacities due to differences in biological aging, lifestyle factors, and disease burden.
Physical performance tests answer specific, practical questions. They determine how fast a person walks at their normal pace, how many times they can stand from a seated position without arm assistance, or how long they can maintain stability in a narrow stance. They do not identify the specific molecular driver responsible for a limitation. A slow walking speed indicates elevated risk and reduced reserve, but it cannot differentiate whether the primary cause is mitochondrial dysfunction in skeletal muscle, subclinical vascular disease, osteoarticular pain, or peripheral neuropathy.
Recognizing this distinction prevents clinical overinterpretation. Physical tests are not direct diagnostic tools for specific cellular pathologies, nor do they represent a single biological clock. In gerontology, researchers emphasize that no single biomarker can capture the full complexity of human aging. Phenotypic performance assessments provide an indispensable, non-invasive readout of functional resilience that complements laboratory diagnostics. Readers can review broader testing frameworks through age biomarker diagnostics to understand how functional and biochemical panels align.
Physical capability cannot be summarized accurately by a single movement pattern. Different functional tests place distinct demands on muscular strength, rate of force development, sensory integration, motor planning, and aerobic endurance. Researchers and clinicians use a battery of standardized tests to sample these diverse physiological domains.
Handgrip dynamometry measures the maximal isometric force generated by the hand and forearm muscles. The test is commonly administered using an adjustable hydraulic dynamometer, such as a Jamar device. The participant squeezes the handle with maximal effort while seated or standing according to a defined protocol. Grip strength serves as a practical, widely studied proxy for general muscular strength and physical capability.
Lower grip strength correlates strongly with adverse outcomes in older adults, including higher all-cause mortality, increased incidence of disability, and longer hospital stays. The European Working Group on Sarcopenia in Older People (EWGSOP2) uses low grip strength as the primary diagnostic indicator of suspected sarcopenia. Consensus diagnostic thresholds are set at less than 27 kilograms for men and less than 16 kilograms for women.
Grip strength is not a direct assay of total-body muscle mass or lower-extremity strength. Hand osteoarthritis, carpal tunnel syndrome, localized pain, peripheral nerve compression, and poor effort can lower recorded values independently of systemic aging. Grip strength must be interpreted as a specific measure of upper-limb isometric force rather than an infallible summary of whole-body musculoskeletal health.
Gait speed measures the time required to walk a specified short distance, typically four meters, at a self-selected, comfortable pace. Distance divided by time yields speed in meters per second. Walking is an integrated motor task that requires coordinated muscle activation, dynamic balance control, sensory feedback from visual and proprioceptive pathways, and adequate cardiopulmonary function.
Gait speed is one of the most robust predictors of longevity in older populations. Epidemiological meta-analyses demonstrate that faster walking speeds are consistently associated with lower mortality rates. EWGSOP2 guidelines identify a usual gait speed of 0.8 meters per second or lower as an indicator of severe sarcopenia.
Gait speed reflects integrated systemic performance, but it lacks anatomical specificity. A reduction in walking speed can stem from degenerative joint disease, neurological deficits, muscle weakness, visual impairment, cognitive decline, or cardiopulmonary limitations. It serves as an early warning indicator of reduced physiological reserve rather than a standalone diagnostic test for a specific disease.
The chair stand test evaluates an individual's ability to rise from a standard seated position to a full standing position without using the arms for leverage or support. The five-times sit-to-stand test measures the total time required to complete five consecutive, rapid stand-and-sit cycles. The thirty-second chair stand test records the total number of unassisted stands completed within a thirty-second window.
These assessments sample lower-extremity muscular strength, dynamic power, joint mobility, and neuromuscular coordination. Rising against gravity places substantial mechanical demands on the quadriceps, gluteal musculature, and plantar flexors. Because power generation declines faster than maximal strength during aging, the chair rise test often reveals early neuromuscular deficits before simple walking speed becomes impaired.
Chair stand performance is sensitive to non-muscular variables. Knee or hip osteoarthritis pain can significantly lengthen completion times. Vestibular dysfunction or fear of falling can cause participants to hesitate during the transition between sitting and standing. Variations in chair height and seat firmness also alter the biomechanical leverage, making protocol consistency critical.
Balance assessments evaluate postural control by challenging the sensory and motor systems responsible for maintaining the center of mass over the base of support. The standard balance component of the Short Physical Performance Battery uses three progressively challenging positions held for up to ten seconds each.
Maintaining postural stability requires real-time integration of vestibular, visual, and somatosensory inputs, paired with rapid motor corrections from ankle and hip musculature. Impairments in balance testing correlate with an elevated risk of accidental falls, mobility loss, and subsequent loss of independence.
The Short Physical Performance Battery (SPPB) is a validated composite assessment combining three functional domains: standing balance, usual gait speed over a four-meter course, and the five-times chair stand test. Each domain is scored from 0 to 4 based on standardized performance criteria, yielding a total composite score ranging from 0 to 12.
Higher SPPB scores represent superior lower-extremity physical function. A score of 10 to 12 indicates normal functional capacity, scores from 7 to 9 suggest mild to moderate functional limitations, and scores of 6 or below indicate severe functional impairment. Combining three distinct domains allows the SPPB to capture compensatory strategies where a patient might maintain walking speed despite declining balance or lower-body power.
Clinical researchers often use supplementary assessments to examine broader mobility dimensions. The Timed Up and Go (TUG) test requires a participant to stand from an armchair, walk three meters, turn around, walk back, and sit down. The TUG test incorporates transitional movements, linear gait, turning mechanics, and postural adjustments into a single timed score.
The Six-Minute Walk Test (6MWT) measures the total distance an individual can walk along a flat course in six minutes. Unlike short-course gait tests that capture baseline neuromuscular coordination, the six-minute walk evaluates submaximal aerobic capacity, cardiovascular endurance, and systemic fatigue resistance. These extended assessments complement basic batteries by testing functional stamina under prolonged effort.
Small variations in testing procedures can significantly distort functional scores. Comparing a chair stand performed on a low, soft chair to one performed on a high, rigid chair introduces mechanical bias that obscures true biological changes. Reliable longitudinal monitoring requires strict adherence to standardized field protocols.
Handgrip testing must follow an established protocol to ensure comparability over time. Assessors must document the device model, the exact handle position, and the participant's posture during testing.
The participant must be instructed to squeeze as hard as possible for three to five seconds. Standardized verbal encouragement should be delivered uniformly across trials. If a patient experiences acute hand or wrist pain during the contraction, the pain must be documented, as it invalidates the score as a pure measure of muscle capacity.
Gait speed must be measured over a clear, unobstructed indoor course. Standard protocols specify testing at the participant's usual, comfortable pace rather than their maximal walking speed. Instructions must clearly reflect this distinction.
Acceleration and deceleration zones of at least one meter on either end of the course prevent the participant from slowing down before crossing the finish mark. If usual walking aids, such as a cane or walker, are used, their presence must be noted. Longitudinal follow-up must use the same assistive devices to maintain comparability.
The chair stand protocol requires a standard armless chair with a rigid seat. Biomechanical leverage changes drastically with seat height, so the height must be measured and recorded.
The assessor must verify that the participant achieves full hip and knee extension on every repetition and returns fully to the seated position. If the participant cannot complete five repetitions without using their arms for support, the test is terminated. The outcome must be recorded as an inability to complete rather than assigned an arbitrary completion time.
Administering the full SPPB requires completing the balance, gait, and chair stand subtests in an orderly, standardized sequence. Assessors must score each component separately before calculating the composite score.
Safety remains the primary operational consideration during balance testing. The assessor must stand close to the participant to provide support if loss of balance occurs, without providing physical assistance that artificially stabilizes the participant during the timed interval. Readers seeking foundational materials on health assessment methodologies can consult our healthy aging resources.
Physical function tests are among the most thoroughly validated prognostic tools in geriatric epidemiology. Thousands of cohort studies have evaluated the relationship between baseline performance scores and long-term health outcomes, including all-cause mortality, institutionalization, cardiovascular events, and chronic disability.
The relationship between usual gait speed and all-cause mortality is exceptionally consistent across international cohorts. In a landmark pooled analysis of individual data from nine large cohort studies involving older adults, baseline gait speed was strongly associated with survival differences across diverse demographic strata.
The hazard ratio of 0.88 indicates that for every 0.1 meter per second increase in walking speed, the hazard of death decreases by approximately 12 percent. This survival association persists across the full spectrum of measured walking speeds. Individuals walking at 1.2 meters per second or faster consistently demonstrate longer life expectancy than predicted by age and sex alone. Conversely, speeds below 0.6 meters per second identify substantial vulnerability.
Longitudinal changes in gait speed over time also carry independent prognostic weight. In observational studies tracking older adults over eight years, individuals who improved their usual gait speed over a one-year interval exhibited significantly lower subsequent mortality compared to those whose gait speed remained stable or declined.
These longitudinal findings reflect observational associations. They do not prove that artificially accelerating gait speed will directly extend lifespan. Gait speed functions as an external monitor of internal physiological reserve; improvements in speed generally reflect broad systemic recovery or successful adaptation.
Physical performance tests demonstrate strong predictive validity for non-fatal, healthspan-related outcomes. In prospective pooled analyses, faster baseline gait speed is associated with a 18 to 24 percent lower risk of incident mobility disability per 0.1 meter per second increment over four years of follow-up. When evaluating basic activities of daily living, faster walking speed reduces the four-year risk of developing dependent dressing or bathing disability by approximately 20 percent.
In specialized clinical settings, such as geriatric oncology, physical performance provides essential risk stratification. Studies evaluating older cancer patients show that every 0.1 meter per second reduction in walking speed is independently associated with higher rates of unplanned hospitalizations, increased emergency department visits, and poorer treatment tolerance. These relationships hold true even after adjusting for cancer stage, chronological age, and comorbid disease burden.
Reviewing emerging publications on these endpoints through longevity science articles helps contextualize how physical phenotypes match epidemiological risk profiles over decades of follow-up.
Clinical frameworks frequently establish cut points to classify patients, determine eligibility for rehabilitation, or establish diagnostic criteria. While binary thresholds are practical for clinical decision-making, they must be interpreted with an understanding of their underlying limitations.
The European Working Group on Sarcopenia in Older People provides widely referenced operational thresholds for identifying functional deficits. These cut points are derived from statistical distributions in reference populations to identify individuals at elevated risk of adverse outcomes.
These numbers provide clear clinical benchmarks. A grip strength below 27 kilograms in a male patient or a five-times chair stand time exceeding 15 seconds signals a clear need for targeted physical interventions, nutritional review, and clinical evaluation.
Human biology operates on continuous spectrums rather than discrete statistical steps. An individual with a gait speed of 0.81 meters per second does not possess fundamentally different physiological health than an individual walking at 0.79 meters per second. The associated mortality risk increases progressively as performance declines across the entire distribution.
Treating diagnostic thresholds as absolute boundaries creates clinical blind spots. An older adult who experiences a drop in grip strength from 42 kilograms to 29 kilograms has lost substantial muscular reserve. However, because their score remains above the 27-kilogram cutoff, categorical screening would classify them as normal. Tracking continuous values over time provides far greater diagnostic sensitivity than relying solely on binary pass-fail thresholds.
Performance cutoffs must be evaluated against appropriate reference populations. Maximal grip strength is anatomically correlated with body size, hand dimensions, height, and occupational history. Applying fixed absolute cutoffs across diverse global populations can result in systematic over- or under-diagnosis of functional impairment. Clinicians and researchers must document raw numerical scores in physical units alongside any categorical classifications.
Geroscience has advanced rapidly in developing molecular assays to quantify aging mechanisms. These include epigenetic DNA methylation clocks, transcriptomic signatures, telomere length assays, and plasma proteomic panels. Despite their biological precision, molecular assays do not replace physical performance testing. Instead, the two modalities provide complementary data across different levels of biological organization.
Molecular biomarkers capture microscopic processes and biochemical signaling states. However, an isolated molecular readout cannot determine whether an individual possesses the motor control to navigate steps, the strength to recover from a stumble, or the stamina to complete daily activities.
Molecular clocks remain largely associative. While they correlate with chronological age and disease vulnerability across large cohorts, consensus has not emerged regarding their direct causal mechanisms or their reliability for evaluating short-term lifestyle interventions. A patient may display an accelerated epigenetic profile while maintaining excellent muscular strength and aerobic fitness. Relying exclusively on molecular data risks ignoring overt functional deficits or overestimating clinical impairment. Readers exploring biological testing panels can examine biological age testing methods for deeper comparative analysis.
Physical performance testing operates at the macro level. It captures the integrated real-world output of the entire organism, accounting for the cumulative impact of subclinical pathologies, structural degradation, pain, and cognitive status. Functional tests are inexpensive, non-invasive, immediately interpretable, and directly relevant to an individual's personal independence.
The limitation of functional testing is its lack of mechanistic resolution. If an individual's gait speed declines by 0.2 meters per second over two years, the physical test confirms the decline but cannot explain the underlying biological cause. Is the decline driven by neuroinflammation, loss of spinal motor units, capillary rarefaction in muscle tissue, subclinical heart failure, or knee osteoarthritis? Physical testing identifies what is happening to functional capacity, while molecular and clinical diagnostics help explain why it is happening.
Combining functional and molecular assessments creates a comprehensive multi-layered evaluation. A longevity assessment that pairs an epigenetic or proteomic panel with an SPPB battery captures both the cellular environment and its macro-level functional consequences.
Administering and interpreting physical function tests requires vigilance against common methodological errors. Misunderstanding what these tests measure can lead to flawed clinical conclusions, inaccurate tracking, and inappropriate health recommendations.
The strong statistical association between physical performance and mortality often leads to the mistaken belief that motor output directly dictates lifespan. Walking faster does not mechanically cause the cardiovascular system to become younger.
Gait speed and grip strength serve as functional barometers of overall physiological health. While structured exercise training that improves strength and walking speed provides extensive systemic benefits, simply forcing a patient to walk faster during a clinical evaluation does not alter their underlying health. Functional tests must be interpreted as indicators of internal physiological reserve rather than independent causal levers of mortality.
A frequent error in clinical monitoring is comparing results obtained under differing protocols. A gait speed measured over a ten-meter course with a flying start cannot be compared directly to a four-meter walk performed from a static start. The acceleration phase in a four-meter test lowers the calculated average speed.
Similarly, grip strength measured in a seated position with the elbow flexed at 90 degrees yields different force values than grip measured while standing with the arm fully extended. Using a 43-centimeter chair height at baseline and a 48-centimeter chair at follow-up artificially inflates performance because the higher seat improves biomechanical leverage. Longitudinal comparisons are valid only when test parameters remain identical.
When a participant cannot complete a physical test due to pain, weakness, or balance loss, assessors sometimes exclude the data or mark it as missing. This practice introduces significant survivorship bias into longitudinal datasets.
An inability to complete a five-times chair stand test without using the arms is not missing data; it is a critical clinical finding indicating severe lower-body functional limitation. Protocols must record an uncompleted test as a specific categorical outcome rather than omitting the record.
Physical performance varies based on immediate physiological and environmental context. An individual suffering from acute viral infection, systemic dehydration, sleep deprivation, or unmanaged joint inflammation will perform significantly worse on functional tests.
These short-term performance drops reflect temporary functional state rather than permanent biological deterioration. Before attributing functional decline to the chronic aging process, clinicians must verify that the participant is free from acute illness, musculoskeletal injury, and severe fatigue.
Recognizing distinct functional patterns helps clinicians and researchers identify physiological vulnerabilities and guide targeted interventions. The following case patterns illustrate how discordant test results provide clinical insight.
An individual demonstrates a four-meter gait speed of 0.72 meters per second, falling below the sarcopenia threshold, but achieves an above-average grip strength of 38 kilograms.
This discordance indicates that systemic muscle weakness is unlikely to be the primary driver of functional decline. The assessor should investigate lower-extremity joint pain, hip or knee osteoarthritis, lumbar spinal stenosis, vestibular imbalance, or visual impairment. Collapsing functional health into a single global score would obscure this distinct anatomical pattern.
A participant records a grip strength of 18 kilograms alongside a five-times chair stand time of 18.5 seconds, while maintaining an unassisted gait speed of 0.95 meters per second.
This pattern demonstrates generalized, multi-segmental muscular weakness. The preservation of walking speed occurs because flat-ground walking requires lower peak muscle forces than rising from a chair or generating maximal isometric grip. This individual exhibits clear signs of developing sarcopenia and requires targeted progressive resistance training to rebuild muscle mass and power.
A participant achieves a brisk gait speed of 1.15 meters per second on the four-meter course, but fails to maintain the full tandem stance for more than three seconds during balance testing.
Evaluating walking speed alone would lead to an overly optimistic assessment of this individual's physical resilience. Momentum during continuous walking can mask underlying deficits in postural control. The isolated balance impairment identifies a substantial risk for accidental falls, particularly when negotiating uneven terrain or turning rapidly. Interventions should prioritize balance training, sensory integration, and vestibular evaluation.
A longitudinal tracking record shows a patient's five-times chair stand time increasing from 10.2 seconds to 14.1 seconds over a six-month interval, suggesting rapid neuromuscular deterioration.
Investigation reveals that the baseline test was performed on a high examination chair, whereas the follow-up test was conducted on a lower waiting-room chair. The five-centimeter reduction in seat height substantially increased the knee extensor moment required to rise. When re-tested on the original 48-centimeter chair, the patient completed the test in 10.4 seconds. This case highlights the absolute necessity of standardized, documented testing equipment.
To maximize the utility of physical function testing, clinical practices and research programs must implement rigorous data reporting standards. Simply recording a final classification such as normal or impaired discards essential clinical nuance.
Every physical performance report should include the raw quantitative values, the exact units of measurement, the specific equipment used, and any protocol adaptations.
Maintaining this level of documentation ensures that longitudinal changes reflect true biological shifts rather than variations in clinical administration.
Testing should be postponed until the individual has recovered from acute infections, transient systemic illnesses, or acute soft-tissue injuries. Physical function tests capture real-time physiological performance. Testing during an acute illness records temporary functional compromise rather than baseline biological reserve. If testing cannot be postponed, the acute condition must be explicitly documented in the report, and the results should not be compared directly against healthy baseline records.
Wearable sensors provide valuable passive data regarding daily step counts, continuous walking cadence, and heart rate variability in free-living environments. However, they do not replace standardized functional testing batteries. Wearables capture habitual behavior, which is heavily influenced by occupational demands, weather, and personal habits. Standardized functional tests measure maximal capacity and standardized performance under uniform, controlled conditions. The two data sources provide complementary perspectives on functional health.
Participants should perform gait testing using their customary walking aids, such as single-point canes, quad canes, or rollator walkers. The exact type of assistive device must be documented in the assessment record. For longitudinal tracking, follow-up tests must be conducted using the same assistive device. If a patient improves sufficiently to transition from a rollator to unassisted walking, this transition should be documented as a major functional milestone, and new baseline values should be established.
Aging is a complex, multi-system process that proceeds heterogeneously across different biological domains. Epigenetic methylation clocks sample molecular marks in circulating leukocytes or epithelial cells. While these marks reflect cumulative cellular stress, they do not account for mechanical adaptations, muscular hypertrophy from resistance exercise, or neuromuscular motor efficiency. An individual with elevated molecular markers can maintain high physical reserve through regular exercise, neuromuscular conditioning, and favorable body composition. Evaluating both domains ensures that molecular risks are contextualized by real-world physical capacity.
Stay current with research on aging biology, biomarkers, nutrition, therapeutics, peptides and longevity technology. AgeAmaze reports what the evidence shows, where uncertainty remains and which claims still need stronger data.


Follow AgeAmaze for careful reporting on what longevity science can show today and what still needs stronger evidence.
read the Blog




