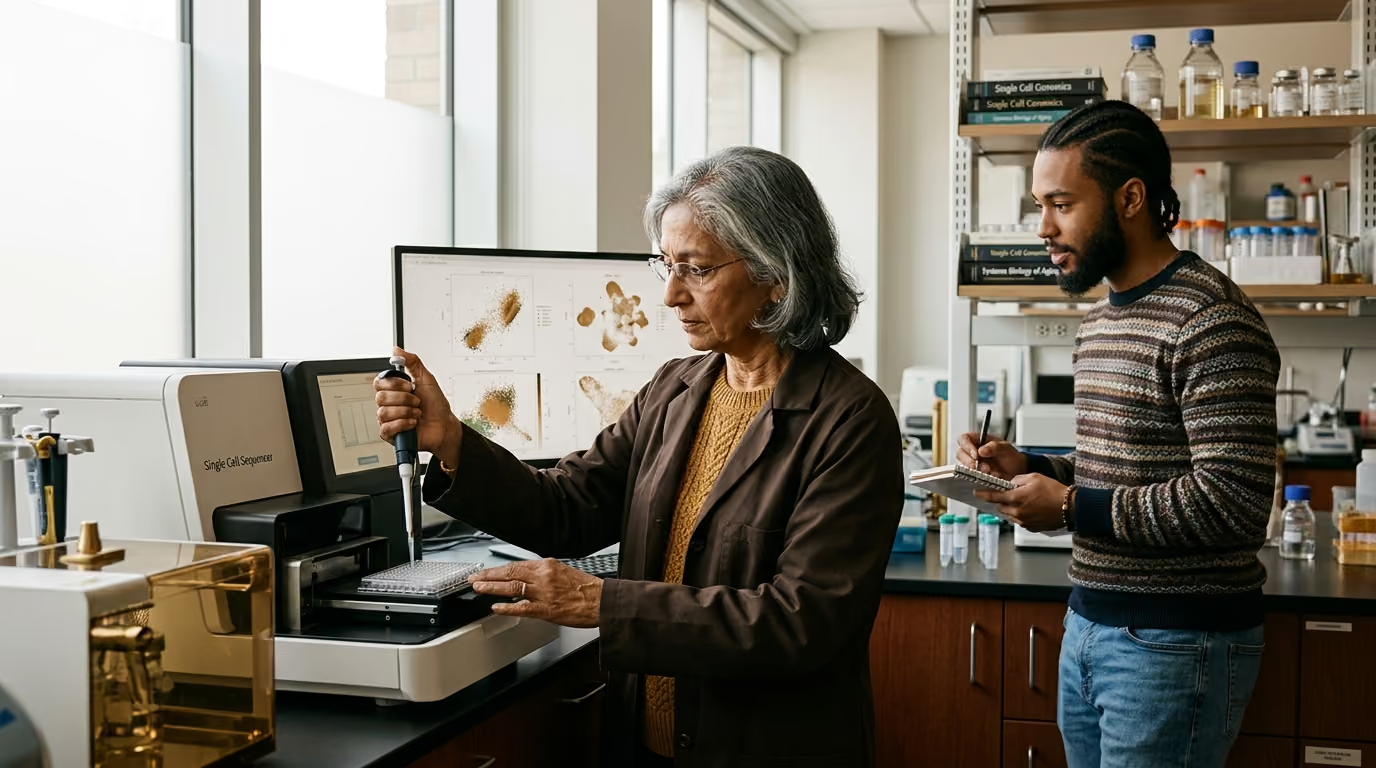

Twelve biological hallmarks of aging require advanced multi-omics, single-cell analysis, and rigorous perturbation screens to uncover causal mechanisms across complex tissues.





Modern aging research is not the search for an isolated longevity switch or a single biological clock. Instead, it is an empirical investigation into how complex biological systems degrade, adapt, and reorganize across time. Aging involves interacting processes across molecular, cellular, tissue, and systemic levels. To understand these dynamics, researchers use high-resolution tools such as single-cell sequencing, multi-layer omics, lineage tracking, and high-throughput perturbation screens.
These advanced methods provide unprecedented resolution. They allow scientists to map aging biology in specific cell types rather than relying on blended tissue averages. However, creating a high-resolution map is not the same as proving a biological mechanism. Observational data, no matter how detailed, cannot replace controlled functional tests.
This guide reviews the primary technologies driving contemporary longevity science. It explains what these tools measure, outlines their technical boundaries, and details why testing causal mechanisms remains necessary to turn molecular observations into validated discoveries.
Aging is characterized by interconnected biological changes rather than a single uniform decline. The established scientific framework identifies twelve distinct hallmarks of aging. These include genomic instability, telomere attrition, epigenetic alterations, loss of proteostasis, and disabled macroautophagy. They also encompass deregulated nutrient-sensing, mitochondrial dysfunction, cellular senescence, stem-cell exhaustion, altered intercellular communication, chronic inflammation, and dysbiosis.
These processes do not unfold at the same speed in every tissue or cell type. A brain cell experiences distinct mechanical and metabolic stressors compared to a liver cell or an immune cell. Examining whole organs using traditional bulk analysis averages all cell types together. This averaging can hide critical changes occurring in rare cell populations, such as adult stem cells or early senescent cells.
To build an accurate picture of aging, researchers examine biological systems through a structured sequence:
This structured workflow prevents researchers from mistaking a correlation for a biological cause. It forms the backbone of modern work in the biology of aging and longevity science.
Traditional molecular assays rely on bulk sequencing. Bulk assays grind up entire tissue samples, measuring the average concentration of molecules across millions of cells. If a rare population of stem cells loses function while surrounding structural cells expand, bulk sequencing will obscure the stem-cell signal. Single-cell technologies solve this limitation by isolating individual cells and profiling their unique molecular contents.
Single-cell RNA sequencing, known as scRNA-seq, measures gene expression inside single intact cells. This method captures RNA molecules with unique molecular identifiers, mapping the distinct expression profile of thousands of cells at once. Researchers use scRNA-seq to detect rare cell states, track immune cell shifts, and identify changes in cell-type proportions over time.
A landmark effort using this method is the Tabula Muris Senis project, also known as the Mouse Aging Cell Atlas. This research initiative profiled over 350,000 individual cells across 23 mouse tissues and organs. The animals spanned six distinct ages, from one month to thirty months. The atlas demonstrated that aging does not follow a single universal trajectory. Certain cell types, such as specific immune subsets and endothelial cells, show substantial transcriptional changes, while other cell types maintain relatively stable gene-expression patterns across the lifespan.
Single-nucleus RNA sequencing, or snRNA-seq, offers an alternative by profiling RNA isolated from cell nuclei rather than whole cells. This distinction is critical when studying delicate, fibrous, or highly interconnected tissues such as skeletal muscle, heart tissue, and adult brain tissue. Isolating intact whole cells from these organs often requires harsh enzymatic digestion that can destroy fragile cells. Furthermore, enzymatic processing can trigger artificial stress responses, altering gene expression before sequencing occurs. Nuclear sequencing bypasses these harsh isolation steps, making it possible to profile frozen human biobank samples.
Single-cell measurements can also be paired with epigenomic assays. Single-nucleus Assay for Transposase-Accessible Chromatin using sequencing, known as snATAC-seq, measures open chromatin regions across individual nuclei. For instance, in studies of healthy aging mammary tissue, combining scRNA-seq with snATAC-seq revealed that changes in chromatin accessibility directly precede changes in transcript abundance. These paired assays help researchers separate physical changes in DNA packaging from active gene transcription.
These single-cell tools clarify how aging alters tissue composition. They show whether an observed tissue change is caused by individual cells altering their internal function, by shifts in the relative abundance of distinct cell types, or by a combination of both.
Biological function depends on the flow of information across multiple layers, from the genetic code to active metabolites. Measuring a single molecular layer provides an incomplete view of cellular health. Multi-omics approaches integrate datasets across several biological strata to build a coherent model of cellular aging.
Each omic layer captures a unique aspect of cellular physiology:
Integrating these layers is essential because gene transcription does not always lead to functional protein production. A cell may increase the production of an RNA transcript, but if its ribosomal translation machinery is impaired, functional protein levels will not rise. Similarly, proteins may accumulate in non-functional aggregates due to impaired autophagy, a state that transcriptomics alone cannot detect.
Multi-omics research projects, such as the Aging Atlas, combine these diverse layers to study systemic decline. By cross-referencing single-cell transcriptomes with proteomic profiles and metabolite levels, researchers can track how nutrient signaling imbalances disrupt protein homeostasis. Investigating these multi-layer interactions is fundamental to cellular health and metabolism research.
Even comprehensive multi-omic profiles remain fundamentally observational. Correlating a change in DNA methylation with altered metabolite levels does not prove that the epigenetic mark caused the metabolic shift. Without directed functional testing, multi-omic integration produces lists of linked candidates rather than verified causal mechanisms.
Static sequencing experiments capture only a single moment in time. They cannot track how individual cells divide, survive, and contribute to tissue repair over an organism's life. Genetic lineage tracing solves this challenge by permanently marking progenitor cells and tracking their descendants across time.
Lineage tracing relies on genetic labels, such as fluorescent reporter proteins or unique synthetic DNA barcodes, introduced into progenitor cells. When a labeled cell divides, every daughter cell inherits the identical mark. Researchers can then track how specific stem cell clones expand or die out during aging.
This method has yielded critical insights into hematopoietic aging. In young animals, blood production is balanced across a diverse pool of hematopoietic stem cells. These cells generate equal proportions of lymphoid cells, which include B cells and T cells, and myeloid cells, which include granulocytes and macrophages.
As organisms age, this stem cell pool undergoes a marked clonal shift:
Lineage tracing clarifies that aged tissues are not simply composed of uniformly exhausted cells. Instead, they are frequently dominated by specific expanded clones that outcompete other cell lineages. Combining genetic lineage tracing with single-cell sequencing allows researchers to profile the molecular states of these dominant clones, distinguishing true cellular dysfunction from shifts in clonal abundance.
Observational omics experiments identify thousands of molecular changes that coincide with aging. However, they cannot determine which changes drive functional decline and which are harmless side effects. Causal testing requires deliberate interventions, known as perturbation experiments, to manipulate specific genes or pathways and measure the functional results.
High-throughput perturbation screens link gene manipulation directly to molecular outcomes. A prime example is Perturb-seq, which combines pooled CRISPR-based gene editing with single-cell RNA sequencing. In a Perturb-seq experiment:
This approach allows researchers to test hundreds of genetic hypotheses in a single experiment. It helps researchers prioritize which molecular pathways directly control senescence markers, inflammatory signals, or mitochondrial maintenance.
However, high-throughput screens have limitations. A genetic knockout can trigger indirect downstream effects that appear days after the original perturbation. If intermediate regulatory steps occur between the knockout and the measurement, the resulting expression profile may reflect secondary stress responses rather than direct gene regulation.
Furthermore, perturbations conducted in cell culture cannot replicate the physiological complexity of intact tissues. Demonstrating that a gene knockout prevents a senescence-associated marker in isolated fibroblasts does not prove that it will improve tissue function or extend animal healthspan. Discoveries from cellular screens require validation in living animal models before they can inform longevity interventions and therapeutics.
Dissociating tissues into single-cell suspensions destroys the physical structure of the organ. It removes critical information regarding where cells lived, which neighboring cells they contacted, and how they interacted with the extracellular matrix. Spatial biology technologies solve this issue by measuring molecular expression directly inside intact tissue sections.
Spatial transcriptomics and multiplexed spatial proteomics map the distribution of RNAs and proteins across histological tissue slices. These methods reveal that aging processes are rarely distributed evenly throughout an organ. Instead, aging changes often cluster within distinct local microenvironments:
Spatial profiling allows researchers to determine whether an age-associated inflammatory signal is generalized or confined to specific histological boundaries. This spatial understanding is critical for emerging work in future longevity and life extension science.
However, physical proximity does not automatically prove direct cellular communication. Two cell types may reside beside one another without exchanging functional molecular signals. Spatial co-localization generates hypotheses about cellular interactions, but demonstrating true intercellular signaling requires functional perturbation or targeted biochemical validation.
The rapid growth of high-throughput sequencing has generated massive biological datasets. Yet large sample sizes and deep molecular coverage cannot transform an observational association into causal proof. A molecular alteration that correlates with age may represent an adaptive protective response, a bystander byproduct of metabolic activity, or an artifact of tissue collection.
To evaluate scientific claims accurately, researchers use a structured hierarchy of evidentiary strength:
This hierarchy is especially important when evaluating biological age measures and molecular clocks, a subject explored further in age biomarkers and diagnostics. A biomarker can predict chronological age or mortality risk without serving as a functional driver of the aging process.
Treating a predictive surrogate marker as a therapeutic target can lead to misleading conclusions. Altering a surrogate marker without influencing the underlying pathology does not improve healthspan. High-throughput omics excel at identifying candidates at Levels 1 and 2 of the hierarchy. Progressing to Level 4 and beyond requires rigorous functional models and controlled intervention trials.
Single-cell and multi-omic studies involve intricate experimental pipelines. Technical errors during sample collection, cell preparation, or computational processing can produce false biological signals. Researchers must identify and control for several well-documented pitfalls:
A frequent error in single-cell analysis is treating individual cells as independent biological replicates. Sequencing 10,000 cells from a single mouse does not equal an experimental sample size of 10,000. It remains a sample size of one. Cells originating from the same animal share identical genetic backgrounds, housing conditions, and exposure histories.
Statistical models must account for this hierarchical structure. Researchers must use multiple independent biological animals or human donors per condition to draw valid conclusions about aging populations.
Batch effects occur when samples are processed on different days, with different reagent lots, or by different technicians. If all young tissue samples are processed on Monday and all old tissue samples on Friday, technical variation becomes perfectly entangled with biological aging. Computational algorithms cannot reliably separate these confounded variables after sequencing.
Proper study design requires distributing young, middle-aged, and old samples evenly across every experimental batch. This balancing ensures that technical variation does not masquerade as an age-associated finding.
Isolating single cells requires mechanical mincing and enzymatic digestion. This process affects distinct cell types unevenly. Tough structural cells, such as fibrotic fibroblasts and mature neurons, often lyse during dissociation, while floating immune cells survive easily.
As tissues age, they frequently develop higher levels of fibrosis and crosslinked extracellular matrix. This physical change can make cells from older animals harder to extract than cells from young animals. A decrease in a specific cell type in an aged sequencing dataset may simply reflect decreased extraction efficiency rather than true cellular loss in living tissue.
Single-cell analysis tools use algorithms to group cells into clusters based on shared gene-expression patterns. If these clustering algorithms are set too aggressively, they can divide a continuous biological state into artificial, discrete cell types. Researchers must validate proposed clusters by confirming that distinct functional markers, spatial locations, or biological behaviors support the computational boundaries.
High-quality single-cell and omics studies address these challenges through deliberate design choices:
To help researchers evaluate modern geroscience literature, the following summary outlines the core tools, their direct biological measurements, and their primary limitations.
Single-nucleus sequencing isolates nuclei rather than intact cells. It avoids the harsh enzymatic dissociation and warm incubation steps required for whole-cell isolation. This reduces artificial stress-response gene expression. It also preserves fragile, interconnected cells from tissues such as the brain, skeletal muscle, and heart, and works on frozen biobank samples.
Epigenetic clocks measure DNA methylation patterns that correlate with age and mortality risk. However, they are surrogate predictive biomarkers rather than direct causal drivers of aging. Showing that an intervention alters a methylation clock score demonstrates that the biomarker responded. It does not prove that the intervention extended organismal lifespan or preserved physiological tissue function.
Standard single-cell sequencing requires breaking tissues apart into single-cell suspensions, which destroys anatomical context. Spatial transcriptomics measures gene expression while keeping the tissue section intact. This allows scientists to see exactly where gene programs are active and how cells interact within local tissue microenvironments.
An age association means that a molecular marker changes in step with chronological age. A causal driver is a mechanism whose alteration directly changes the rate of physiological decline or modifies healthspan. Many molecular changes are harmless byproducts or protective responses to aging stress rather than primary causes of decline.
Stay current with research on aging biology, biomarkers, nutrition, therapeutics, peptides and longevity technology. AgeAmaze reports what the evidence shows, where uncertainty remains and which claims still need stronger data.


Follow AgeAmaze for careful reporting on what longevity science can show today and what still needs stronger evidence.
read the Blog