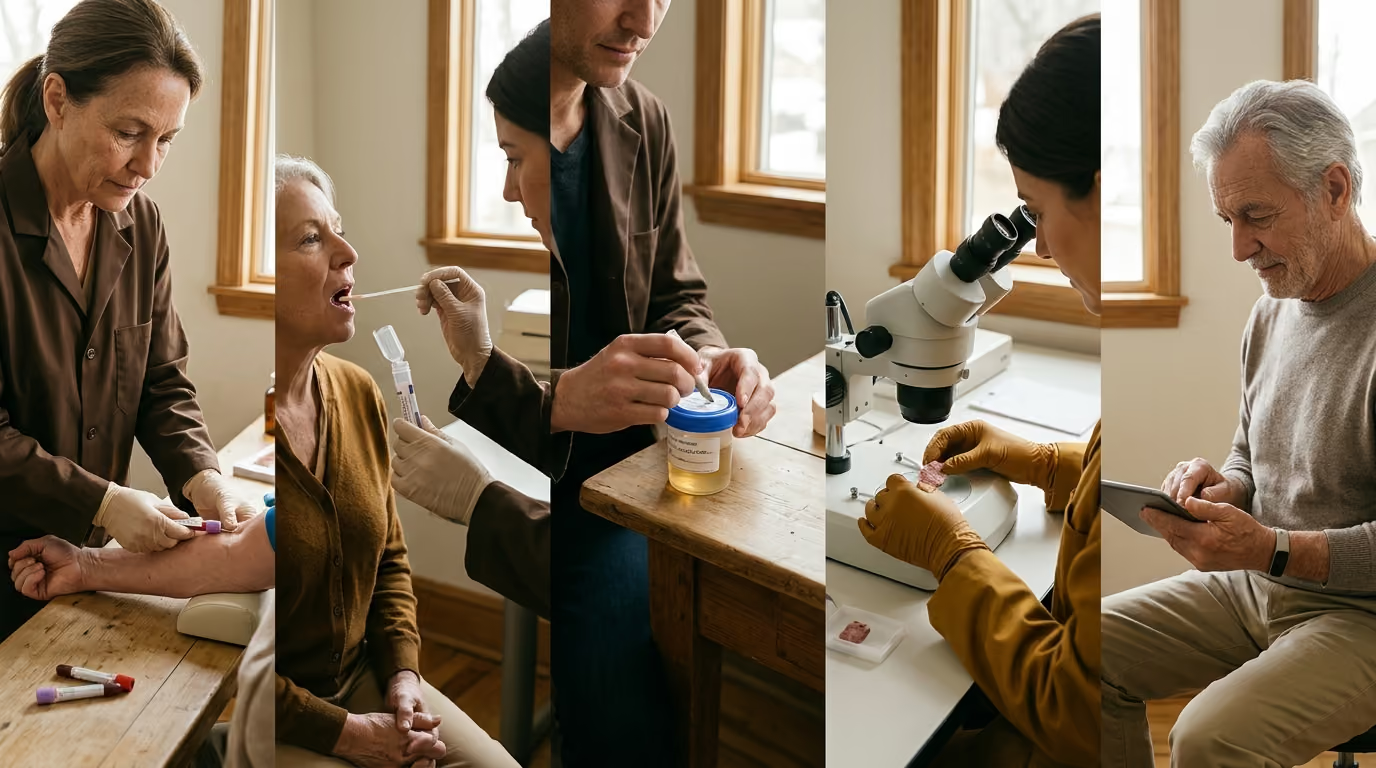

Accurate interpretation of aging biomarkers across blood, saliva, urine, and wearables relies on mastering specimen-specific capabilities, metabolic profiles, and pre-analytic limitations.





Imagine opening two test kits from different longevity companies on the same morning. You collect a small vial of blood from a finger prick and spit into a tube to collect saliva. Weeks later, the results arrive. One report claims your biological age is five years younger than your birth certificate, while the other suggests your body is aging faster than average. Meanwhile, the smart ring on your finger shows declining sleep efficiency and elevated resting heart rate over the past three months.
This scenario is common among people tracking longevity metrics. Discrepancies between tests occur because a biological sample is not a direct readout of whole-body aging. Instead, each sample type provides a distinct window into human physiology.
Biological aging is a broad, multidimensional process that affects cells, tissues, and organ systems across decades. No single measurement captures every aspect of this complex trajectory. Every sample choice introduces distinct biological advantages, technical blind spots, and interpretive boundaries.
Understanding what each sample type measures, what it misses, and how laboratory handling affects the final result is essential. This resource breaks down the science behind blood, saliva, urine, solid tissue, and wearable devices. It explains how sampling choices shape the data and why biological age is a family of distinct measurements rather than a single number.
Before evaluating specific sample types, it is necessary to establish how researchers define and measure aging. Chronological age measures the amount of time that has passed since birth. In contrast, biological aging refers to the progressive accumulation of molecular damage, cellular shifts, and functional decline over time.
Scientists develop biomarkers to capture these changes before clinical disease appears. However, biomarker models differ fundamentally in their design and mathematical objectives. A model trained to predict chronological age is not the same as a model trained to predict mortality risk or functional decline.
Researchers generally classify molecular models, such as epigenetic clocks, into three distinct categories:
These three approaches answer entirely different questions. A person may have an older chronological prediction but a slow current pace of aging. Conflating these categories leads to confusion when interpreting results.
Biospecimens such as blood, saliva, urine, and solid tissue provide discrete molecular snapshots taken at a single moment. Wearables provide continuous or repeated functional data across days, weeks, and months.
Importantly, no aging biomarker has achieved official clinical validation as a standalone diagnostic tool or surrogate endpoint for lifespan extension. When evaluating longevity literature, exploring age biomarkers and diagnostics resources can help clarify the difference between exploratory research and validated clinical metrics. Every biomarker reflects the compartment sampled, the assay used, and the mathematical model applied.
Blood is the most common sample type in clinical medicine and geroscience. Because blood circulates through every organ system, it carries signaling molecules, cellular debris, metabolic products, and immune cells. This systemic reach makes blood an informative starting point for longevity research.
Blood supports an extensive range of laboratory assays. Researchers use it to evaluate metabolic health, liver and kidney function, lipid transport, endocrine regulation, and chronic inflammation. It is also the primary medium for high-throughput omic technologies, including proteomics, metabolomics, lipidomics, transcriptomics, and DNA methylation profiling.
The term blood biomarker is too broad unless the specific liquid or cellular fraction is identified. Blood is collected into different tubes to produce distinct analytical matrices:
These matrices are not interchangeable. A metabolomic signal observed in plasma may differ from the profile observed in serum due to the clotting process. Studies combining DNA methylation and circulating proteomics often require separate whole blood and plasma collections during the same visit.
Large-scale plasma proteomic investigations have revealed complex shifts in circulating proteins across the human lifespan. One extensive study identified 1,379 proteins whose concentrations change significantly with age. These proteins do not follow a simple, uniform trajectory across life.
Some circulating proteins change in a linear fashion across adult life. Others remain stable for decades before rising around midlife, while others show sharp, exponential increases after age 60. Proteins such as growth differentiation factor 15 (GDF15), sclerostin (SOST), and pleiotrophin frequently appear in the scientific literature as markers that increase with advanced age.
GDF15 is a cellular stress response cytokine associated with inflammation, mitochondrial dysfunction, and cardiovascular risk. Sclerostin is a glycoprotein secreted primarily by osteocytes that regulates bone remodeling. Pleiotrophin is a heparin-binding growth factor involved in cell growth and neural signaling.
While these proteins associate strongly with chronological age and health outcomes in research cohorts, they are not standalone diagnostic tests for individual aging. An elevated level of GDF15 indicates physiological stress, but it does not tell a clinician the exact biological age of a patient.
Blood has distinct biological and physical constraints. First, blood is a transport medium rather than a direct biopsy of solid organs. A blood sample reflects systemic communication and clearance, but it can miss localized cellular damage occurring inside the brain, liver, or skeletal muscle.
Second, bulk blood profiling is heavily influenced by cellular heterogeneity. Blood contains various immune cell types, including neutrophils, monocytes, B cells, CD4+ T cells, CD8+ T cells, and natural killer cells. The proportions of these cells change naturally as people age, an occurrence known as immunosenescence.
When researchers measure DNA methylation in whole blood, the resulting signal represents an average across millions of distinct immune cells. A shift in a blood-based epigenetic clock may reflect a change in the underlying white blood cell ratios rather than true epigenetic reprogramming within individual cells.
Mathematical techniques known as cell-type deconvolution attempt to estimate and adjust for these cellular shifts. However, deconvolution models have limitations and cannot eliminate cell composition effects entirely. A reported change in a blood epigenetic clock after an intervention may simply reflect an altered immune cell mixture.
Finally, untargeted proteomic analysis in blood faces the challenge of dynamic range. Circulating proteins span more than ten orders of magnitude in concentration. Highly abundant proteins, such as albumin and immunoglobulins, constitute more than 85 percent of the total protein mass in human plasma. These abundant proteins can mask lower-abundance signaling molecules, making precise detection of subtle longevity targets technically demanding.
Blood biomarkers are sensitive to collection protocols and pre-analytic processing. Factors unrelated to biological aging can distort downstream measurements if laboratory procedures are not strictly standardized.
Circadian rhythms and nutrient intake alter blood biochemistry. Cortisol, inflammatory cytokines, glucose, insulin, and lipid metabolites fluctuate throughout the day. For reliable comparisons, blood collection should occur at the same time of morning following an overnight fast.
Processing time is equally critical. For plasma and peripheral blood mononuclear cell isolation, centrifugation should ideally occur within 30 minutes of collection. Delays longer than two hours allow cell degradation, platelet activation, and enzyme activity to alter the molecular composition of the sample.
Freezing protocols also affect sample integrity. Researchers must aliquot samples into single-use vials before freezing at minus 80 degrees Celsius. Subjecting serum or plasma to multiple freeze-thaw cycles degrades fragile proteins, alters peptide stability, and produces artificial shifts in metabolomic readings.
Saliva collection has gained widespread popularity in consumer longevity tests and large cohort studies. It is non-invasive, painless, and does not require a trained phlebotomist or clinical facility. Participants can collect their own samples at home and return them through the mail.
Saliva contains oral fluids, antimicrobial peptides, metabolic products, and sloughed host cells. It provides an accessible source of human genomic DNA, making it suitable for genotyping, sequencing, and epigenetic profiling.
Several multi-tissue epigenetic clocks have been validated for use on oral samples. For pediatric populations, frail older adults, and remote clinical trials, saliva offers an acceptable alternative to venipuncture when assessing broad genomic patterns. Researchers studying the biology of aging research frequently utilize oral samples to expand participant enrollment across diverse geographical cohorts.
The most critical mistake in interpreting saliva data is assuming that saliva is simply a diluted form of blood. Blood and saliva contain completely different cell populations, which directly alters DNA methylation measurements.
Whole blood DNA is derived almost entirely from circulating leukocytes, which are immune cells. In contrast, saliva contains a mixture of oral epithelial cells and migrated immune cells. Studies evaluating oral sample composition show that saliva typically contains approximately 65 percent immune cells and 35 percent epithelial cells.
Buccal swabs, which collect cells scraped directly from the inside of the cheek, consist primarily of buccal epithelial cells. However, they can still contain variable numbers of white blood cells depending on oral mucosal inflammation.
Because epithelial cells and immune cells have vastly different epigenetic structures, bulk methylation profiles differ substantially between blood and saliva. An epigenetic clock trained specifically on whole blood data cannot be applied directly to saliva without generating significant systematic error.
If a blood-trained clock is applied to saliva, the algorithm may interpret normal epithelial methylation patterns as accelerated biological aging. Researchers must use epigenetic clocks calibrated specifically for oral specimens or models developed on multi-tissue datasets.
While saliva is an accessible DNA source, it has major limitations for broad biomarker discovery. Saliva is poorly suited for comprehensive proteomic or metabolomic aging panels. Most high-throughput proteomic platforms used in geroscience are engineered and standardized specifically for blood plasma or serum.
Saliva composition is also vulnerable to acute environmental confounders. Recent food intake, beverage consumption, tooth brushing, smoking, and gum chewing alter oral biochemistry.
Local oral conditions, such as gingivitis, periodontitis, and mucosal irritation, cause massive influxes of neutrophils and other inflammatory cells into the oral cavity. This local immune reaction changes the cellular ratio in the saliva tube, altering downstream epigenetic scores independently of systemic aging.
To minimize these errors, collection protocols require participants to rinse their mouths with water and fast from food and drink for at least 30 minutes before spitting. Longitudinal studies must maintain identical collection protocols across every visit to prevent behavioral changes from mimicking biological shifts.
Urine is one of the oldest diagnostic fluids in clinical medicine. It is routinely used to screen for renal disease, urinary tract infections, metabolic imbalances, and diabetes. In longevity research, urine provides a non-invasive look at the end products of human metabolism and clearance pathways.
Urine contains water-soluble waste products, filtered amino acids, organic acids, hormones, and cleared environmental metabolites. Because it reflects filtration and excretion, urine can highlight metabolic shifts that occur as organs age.
Comparative metabolomic studies have examined urine differences between age cohorts. In one comparative analysis of 33 younger and 33 older human participants, researchers identified 32 significantly altered chemical compounds.
Older individuals exhibited higher urinary concentrations of trimethylamine N-oxide (TMAO), scyllo-inositol, citrate, and ascorbic acid. At the same time, older participants showed lower urinary levels of specific amino acids and acetate. TMAO is a gut-microbiome-derived metabolite associated with cardiovascular risk, while citrate and scyllo-inositol reflect cellular energy metabolism and carbohydrate pathways.
In a separate urinary investigation, researchers identified 55 candidate metabolic markers associated with chronological age. These metabolites represented pathways involving energy production, nucleotide breakdown, and antioxidant regulation.
Urine has also been used to study age-related changes in trace metal clearance. Researchers have evaluated urinary excretion rates of iron, zinc, copper, and manganese. In one exploratory study, urinary manganese levels showed a statistical association with biological age acceleration measured by DNA methylation clocks.
A 1 nanogram per milliliter increase in urinary manganese correlated with an estimated 9.93-year increase in biological age in that specific cohort. However, trace metal excretion is heavily influenced by occupational exposure, diet, and environmental toxicology. Such statistical correlations represent exploratory research observations rather than established clinical rules.
Despite its accessibility, urine is one of the most difficult biological matrices to interpret accurately in aging research. Urine is not a stable circulating pool. It is an excretion product whose concentration varies continuously based on hydration status, physical activity, and time of day.
A central challenge in urine biomarker research is the role of kidney function. The kidneys undergo structural and functional changes as part of normal aging. Glomerular filtration rate, renal blood flow, and tubular concentrating ability all decline gradually over adult life.
When a study observes higher or lower levels of a metabolite in the urine of older adults, that difference can stem from two entirely different biological realities:
Furthermore, most candidate urinary aging markers correlate strongly with urinary creatinine. Creatinine is a breakdown product of muscle creatine phosphate that is filtered freely by the kidneys. Scientists use creatinine to normalize spot urine samples for variable hydration levels.
However, muscle mass and creatinine production decline with age, while renal creatinine clearance also changes. When candidate biomarkers are normalized against a baseline that is itself shifting with age, mathematical distortions can occur.
Currently, there are no clinically validated urinary biological age clocks. Urine studies remain valuable for exploratory geroscience and nephrology, but urine cannot replace blood for comprehensive molecular profiling.
Urinary measurements depend heavily on collection timing and methodology. Spot urine samples collected during random clinic visits exhibit high variability due to fluid intake and recent physical exertion.
First-morning void samples provide a more concentrated, standardized specimen that reflects overnight metabolic activity. For precise metabolic clearance studies, 24-hour urine collections remain the historical gold standard, though they present substantial participant burden and compliance challenges.
Urine samples also require prompt refrigeration or chemical preservation. Bacterial growth begins rapidly at room temperature, which consumes endogenous amino acids and produces artificial ammonia and metabolite spikes that ruin metabolomic assays.
Most commercial tests and clinical trials rely on blood or saliva because collecting solid tissue from living humans is invasive. However, the biology of aging does not unfold at an identical rate across every organ in the body.
Examining solid tissue biopsies highlights the profound difference between systemic biomarkers and localized cellular aging. This distinction is central to modern biological age testing frameworks that seek to map aging across complex organ systems.
Every tissue possesses a distinct cellular architecture, regenerative capacity, and microenvironmental niche. Skeletal muscle contains post-mitotic multinucleated fibers subjected to mechanical loading. The liver contains metabolically active hepatocytes capable of substantial regeneration. The brain contains long-lived neurons and supporting glial cells protected behind the blood-brain barrier.
Because these tissues function differently, their molecular aging signatures diverge. Epigenetic modifications, telomere shortening rates, mitochondrial decline, and the accumulation of senescent cells occur at different rates across different organs in the same individual.
When researchers obtain tissue biopsies, such as skin punch biopsies, skeletal muscle samples, or adipose tissue aspirates, they can directly analyze:
These localized features provide biological insights that circulating blood markers can obscure. A person may exhibit healthy systemic inflammatory markers in their blood while harboring significant localized muscle senescence or vascular stiffening.
The greatest scientific limitation of tissue sampling is the mirror image of its main benefit. A tissue biopsy provides deep local detail, but that detail cannot be generalized across the rest of the body.
A skin biopsy tells researchers about dermal fibroblasts, keratinocytes, and local solar elastosis. It does not reveal the biological state of the coronary arteries, the kidneys, or the central nervous system.
Cross-tissue epigenetic comparisons demonstrate that epigenetic clocks trained on blood samples often fail when applied to solid organs. A blood-derived clock applied to human brain tissue or liver biopsies frequently underestimates or mischaracterizes the chronological and functional age of those organs.
Epigenetic aging clocks operate through tissue-specific mathematical weightings. The cytosine-phosphate-guanine (CpG) sites that predict aging in circulating leukocytes are not the same genomic sites that track cellular aging in skeletal muscle or brain tissue.
Except for specifically designed multi-tissue models, applying an epigenetic algorithm outside its training tissue produces unreliable data. Solid tissue sampling proves that there is no single master clock ticking at a universal speed throughout the human body.
In human longevity research, tissue biopsies are constrained by ethics, safety, and participant burden. Obtaining skeletal muscle or subcutaneous adipose tissue is feasible in controlled clinical trial settings, but repeated biopsies to track interventions over time carry risks of pain, infection, and scarring.
Biopsies of critical internal organs, such as the heart, brain, liver, or kidneys, are impossible in healthy human volunteers. Researchers can only access these tissues during necessary medical procedures, organ transplants, or post-mortem autopsies.
Consequently, solid tissue analysis serves primarily as foundational research in geroscience. It helps scientists discover biological mechanisms, validate systemic surrogate markers, and calibrate multi-tissue models, but it cannot serve as a routine screening tool for personal health tracking.
While biospecimens capture molecular snapshots at fixed time points, digital health technologies capture dynamic human physiology in real time. Smartwatches, fitness rings, chest straps, and continuous monitors have introduced a new class of measurements known as digital biomarkers.
Digital biomarkers are objective, quantified physiological and behavioral measures collected through digital sensors. Understanding how digital monitoring fits into broader longevity technology and future science allows researchers to link molecular data with real-world functional capacity.
Wearable devices continuously track physiological signals across ordinary daily routines. Rather than measuring molecules in a test tube, wearables capture how the intact human organism responds to physical stress, rest, environmental temperature, and circadian rhythms.
Modern wearable devices evaluate multiple physiological systems by tracking:
In large epidemiological cohorts, functional metrics such as daily step count, average gait speed, and accelerometer-measured movement intensity associate strongly with cardiovascular morbidity, all-cause mortality, and frailty onset. An individual who maintains high cardiorespiratory fitness and consistent daily movement exhibits a lower statistical risk of premature mortality.
Wearables provide continuous longitudinal tracking, capturing thousands of data points every week. This continuous monitoring reveals cyclical patterns, seasonal shifts, and acute physiological stress that a single annual blood draw will miss entirely.
However, wearable data must not be confused with molecular aging mechanisms. A wearable device measures functional outputs, not the underlying molecular machinery.
A declining heart rate variability score indicates altered autonomic tone or physiological fatigue, but it does not reveal why the shift occurred. It cannot determine whether the change is driven by vascular stiffness, systemic inflammation, mitochondrial decline, emotional stress, or poor sleep.
Wearables and biospecimens are complementary modalities rather than competing tests. A blood draw provides molecular depth at a single moment, while a wearable device tracks functional trends over time.
Digital biomarkers face technical and behavioral challenges that can distort data quality if not properly managed.
Hardware placement significantly alters sensor output. A photoplethysmography (PPG) optical sensor worn on the wrist yields different raw pulse wave data than an optical sensor worn on the finger or a electrical sensor worn across the chest. Accelerometer metrics collected from the hip do not match data collected from the wrist. Sensor types cannot be treated as directly interchangeable.
Proprietary algorithms represent another major source of variance. Consumer device manufacturers use private, unpublished algorithms to convert raw sensor data into proprietary metrics, such as sleep scores, readiness indices, or stress levels.
These algorithms are updated periodically without public documentation. A sudden improvement in a user's sleep score may reflect a firmware update from the manufacturer rather than a true biological improvement in sleep architecture. Researchers prefer analyzing raw accelerometer and inter-beat interval data rather than proprietary manufacturer scores.
User compliance and wear-time adherence also create data gaps. Devices require regular battery charging, and users often forget to put them back on. Missing data during sleep or exercise skews weekly averages.
Scientific guidelines recommend a minimum of seven consecutive days of continuous 24-hour wear to establish stable baseline metrics. Baseline data must be collected over multiple weeks before an intervention to account for normal day-to-day behavioral fluctuations.
Selecting a sample type involves balancing biological depth, invasiveness, participant burden, and cost. No single modality provides a complete assessment of human aging.
The trade-offs across all five modalities can be broken down across specific operational categories:
Examining how different sample types perform in structured scenarios helps clarify how researchers interpret complex data. The following illustrative research models demonstrate how sample selection dictates scientific conclusions.
A research team designs an exploratory trial to test whether a multi-modal dietary and exercise intervention alters biological aging over six months. At baseline and study conclusion, participants provide whole blood samples for DNA methylation analysis using a second-generation epigenetic clock.
At the end of the trial, the researchers observe a statistically significant reduction in the calculated epigenetic age acceleration score. Before concluding that the intervention reversed cellular aging, the team must systematically investigate potential confounders:
If the reduction in calculated age disappeared after applying mathematical cell-type deconvolution, the researchers must report that the intervention modified circulating immune cell ratios rather than rewriting the epigenetic code of all human tissues.
A research cohort provides simultaneous blood and saliva samples to evaluate consumer biological age testing accuracy. When the data are processed, several participants receive biological age estimates that differ by more than six years between their blood and saliva samples.
The researchers do not conclude that one test is correct and the other is false. Instead, they examine the underlying biology:
The observed difference reflects the distinct cellular compartments sampled and the mathematical models applied. The results represent two different views of the participants' biology rather than an error in laboratory measurement.
A laboratory analyzes spot urine samples from healthy young adults and older adults with mild metabolic dysfunction. The metabolomic screen identifies a significant elevation of a specific organic acid in the older cohort.
Before classifying this compound as a systemic biomarker of aging, the investigators must control for physiological variables:
Without these controls, an apparent biomarker of biological aging may simply reflect mild age-related renal decline or different dietary habits.
Longevity science is evolving rapidly, but enthusiasm must be balanced with methodological realism. Misinterpreting preliminary data as definitive proof of slowed aging harms scientific progress and misleads the public.
Evaluating longevity interventions and therapeutics requires understanding that changing a surrogate biomarker does not automatically mean a clinical trial has extended human life.
Readers and researchers must keep several evidentiary boundaries in mind when reviewing aging biomarker data:
Every biological measurement carries inherent uncertainty. Technical variability arises from minor differences in pipetting, reagent lots, temperature fluctuations, and sequencing plate batches. Even when measuring the exact same blood vial twice, an epigenetic clock can yield results that differ by several months or years.
Biological variability adds another layer of complexity. Biomarkers fluctuate in response to acute sleep deprivation, intense exercise, psychological stress, minor viral infections, and seasonal changes.
If an individual takes a biological age test two days after running a marathon or recovering from an acute respiratory illness, the results may reflect temporary physiological recovery rather than a permanent shift in their rate of aging. Establishing a true baseline requires repeated measurements under standardized conditions.
Understanding geroscience literature requires familiarity with specific technical terms used across molecular biology and clinical research:
Revisit this resource when you are evaluating a new biological age test, interpreting contradictory laboratory results from different sample types, or reviewing longevity intervention studies that claim to measure biological age.
Recognizing that every sample type provides a distinct physiological window allows you to approach longevity science with curiosity, rigor, and healthy scientific skepticism.
Stay current with research on aging biology, biomarkers, nutrition, therapeutics, peptides and longevity technology. AgeAmaze reports what the evidence shows, where uncertainty remains and which claims still need stronger data.


Follow AgeAmaze for careful reporting on what longevity science can show today and what still needs stronger evidence.
read the Blog




